The Net Promoter Score (NPS)—a simple yet powerful tool—can provide actionable insights that drive growth, enhance brand loyalty, and improve overall customer satisfaction.
In the pharmaceutical industry, NPS remains significantly underutilised. Yet, it can be used as a highly effective KPI for engagement as explained by CELforPharma’s faculty of the Strategic Omnichannel for Pharma Marketing course.
❓ What is Net Promoter Score (NPS)?
The Net Promoter Score (NPS) is a widely recognised metric that measures customer loyalty and satisfaction by asking a single question:
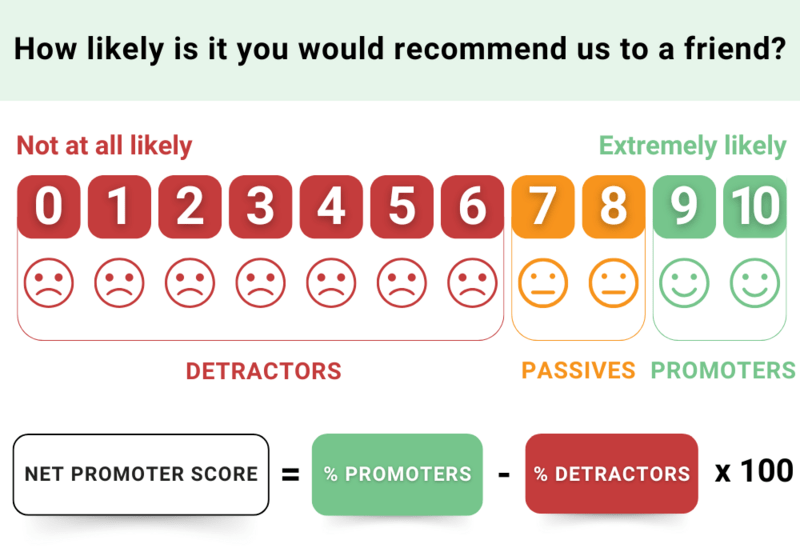
“On a scale from 0 to 10, how likely are you to recommend our product or service to a colleague or peer?”
Based on their responses, customers are categorised into:
- ✅ Promoters (9-10): Loyal enthusiasts who will fuel growth through word-of-mouth.
- ⚖️ Passives (7-8): Satisfied but unenthusiastic customers who are vulnerable to competitors.
- ❌ Detractors (0-6): Unhappy customers who can damage brand reputation and hinder growth.
The formula is simple: NPS = (% Promoters – % Detractors) x 100
The result varies between -100 and +100. The value is used as an indicator for growth.
💡 How can NPS be used in Pharma?
Pharma companies, too, can benefit from this robust KPI. They can and should use it wherever they deal with external stakeholders to motivate their market-facing teams to improve stakeholder loyalty and word-of-mouth.
Here is an example:
Assume you organise a webinar for your HCPs. At the end of the webinar, you ask the following question to the participants: “On a scale of 0 to 10, where 0 is not at all likely and 10 is extremely likely, how likely is it that you would recommend this webinar to your colleagues?”
You get the following responses:
| Webinar A | |
| Dr Pinchard | 9 |
| Dr Jacobson | 8 |
| Dr Roccato | 7 |
| Dr Lane | 10 |
| Dr Carlino | 7 |
| Dr Chaumette | 6 |
| Dr Van Geyt | 9 |
| Dr Tasset | 8 |
| Dr Toh | 7 |
| Dr Kotecha | 8 |
In webinar A, you have the following responses:
- ✅ 3 Promoters (9-10) = 3/10 = 30%
- ⚖️ Passives (7-8) = 6/10 = 60%
- ❌ Detractors (0-6) = 1/10 = 10%
The NPS of the webinar is + 20.
So, what does this mean?
The audience of the webinar will be net promoters of your webinar (more promoters than detractors), which is likely to generate more interest from other HCPs in the future. Following up with Promoters can generate testimonials and/or referrals.
The focus for next time is on increasing the % of Promoters, by decreasing the % of Detractors and/or “nudging” the group of Passives to become Promoters, which will increase NPS over time.
➡️ Going beyond the NPS
Now assume you got the following responses on another webinar you organised:
| Webinar B | |
| Dr Gabriel | 10 |
| Dr Jenkins | 9 |
| Dr Malinen | 5 |
| Dr Smedt | 6 |
| Dr Taylor | 10 |
| Dr Woolley | 6 |
| Dr Mirkovic | 10 |
| Dr Johnson | 9 |
| Dr Pfeiffer | 9 |
| Dr Huguet | 4 |
The NPS of this webinar is also + 20. So, at first glance, both webinars performed equally well. But because NPS is a summary statistic, you should dig deeper:
- In webinar B there are 60% Promoters vs. 40% Detractors and no Passives at all. This means there were 2 segments in the audience of webinar B, with different expectations. Next time, the communication will need to improve so that all participants have the right expectations.
- It is important to find out the rationale of those scoring between 0-6. You will likely discover how to improve the overall experience for your audiences.
- If NPS is negative or too low due to a low % of Promoters, questions can be raised about the effectiveness of the speakers or the subject of the webinar.
🎓 If you want to learn about:
- Online behaviours and needs of pharma’s external stakeholders.
- A step-by-step process to define an omnichannel customer engagement strategy.
- The six omnichannel communication strategies to consider.
- The opportunities, impact and best practices of digital communication channels for pharma & medtech companies.
- How to design a system of KPIs to measure the ROI of your digital tactics.
- How to correctly use key measurement tools, such as MCQ and NPS.
👉 Attend Vladimir Rogiers & Olga Duvillard’s highly praised 2-day course:
Strategic Omnichannel for Pharma Marketing
With Vladimir Rogiers & Olga Duvillard

